

Gartner identified data analytics technology trends that can help organisations respond to change, uncertainty and the opportunities they bring in the next year. D&A leaders should use the following 10 trends as mission-critical investments that accelerate their capabilities to anticipate, shift and respond.
Trend 1: Smarter, Responsible, Scalable AI
The greater impact of artificial intelligence (AI) and machine learning (ML) requires businesses to apply new techniques for smarter, less data-hungry, ethically responsible and more resilient AI solutions. By deploying smarter, more responsible, scalable AI, organisations will leverage learning algorithms and interpretable systems in a shorter time to value and have higher business impact.
Trend 2: Composable Data and Analytics Technology Trends
Open, containerised analytics architectures make analytics capabilities more composable. Composable data and analytics leverage components from multiple data, analytics and AI solutions to rapidly build flexible and user-friendly intelligent applications that help D&A leaders connect insights to actions.
With the centre of data gravity moving to the cloud, composable data and analytics will become a more agile way to build analytics applications enabled by cloud marketplaces and low-code and no-code solutions.
Trend 3: Data Analytics Fabric Is the Foundation
With increased digitisation and more emancipated consumers, D&A leaders are increasingly using data fabric to help address higher levels of diversity, distribution, scale and complexity in their organisations’ data assets.
The data fabric uses analytics to constantly monitor data pipelines. A data fabric utilises continuous analytics of data assets to support the design, deployment and utilisation of diverse data to reduce time for integration by 30%, deployment by 30% and maintenance by 70%.
Trend 4: From Big to Small and Wide Data
The extreme business changes from the pandemic caused ML and AI models based on large amounts of historical data to become less relevant. At the same time, decision-making by humans and AI are more complex and demanding, requiring D&A leaders to have a greater variety of data for better situational awareness.
As a result, D&A leaders should choose analytical techniques that can use available data more effectively. D&A leaders rely on wide data that enables the analysis and synergy of a variety of small and large, unstructured, and structured data sources, as well as small data which is the application of analytical techniques that require less data but still offer useful insights.
“Small and wide data approaches provide robust analytics and AI while reducing organisations’ large data set dependency,” said Ms Sallam. “Using wide data, organisations attain a richer, more complete situational awareness or 360-degree view, enabling them to apply analytics for better decision making.”
Trend 5: XOps
The goal of XOps, including DataOps, MLOps, ModelOps, and PlatformOps, is to achieve efficiencies and economies of scale using DevOps best practices and ensure reliability, reusability and repeatability. At the same time, it reduces duplication of technology and processes and enables automation.
Most analytics and AI projects fail because operationalisation is only addressed as an afterthought. If D&A leaders operationalise at scale using XOps, they will enable the reproducibility, traceability, integrity and integrability of analytics and AI assets.
Trend 6: Engineering Decision Intelligence
Engineering decision intelligence applies to not just individual decisions, but sequences of decisions, grouping them into business processes and even networks of emergent decisions and consequences. As decisions become increasingly automated and augmented, engineering decisions allow D&A leaders to make decisions more accurate, repeatable, transparent and traceable.
Trend 7: Data Analytics as a Core Business Function
Instead of being a secondary activity, D&A is shifting to a core business function. In this situation, D&A becomes a shared business asset aligned to business results, and D&A silos break down because of better collaboration between central and federated D&A teams.
Trend 8: Graph Relates Everything
Graphs form the foundation of many modern data and analytics capabilities to find relationships between people, places, things, events and locations across diverse data assets. D&A leaders rely on graphs to quickly answer complex business questions which require contextual awareness and an understanding of the nature of connections and strengths across multiple entities.
Gartner predicts that by 2025, graph technologies will be used in 80% of data and analytics innovations, up from 10% in 2021, facilitating rapid decision-making across the organization.
Trend 9: The Rise of the Augmented Consumer
Most business users are today using predefined dashboards and manual data exploration, which can lead to incorrect conclusions and flawed decisions and actions. Time spent in predefined dashboards will progressively be replaced with automated, conversational, mobile, and dynamically generated insights customised to a user’s needs and delivered to their point of consumption. 10 brands already leveraging AR.
“This will shift the analytical power to the information consumer — the augmented consumer — giving them capabilities previously only available to analysts and citizen data scientists,” said Sallam.
Trend 10: Data and Analytics Power Hyper-Personalisation
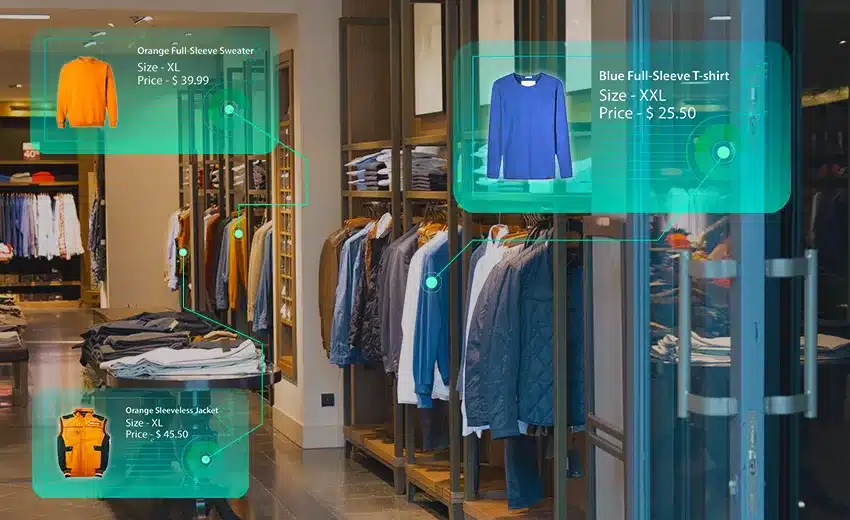
Hyper-personalised solutions, using AI machine learning, the distinction between vendors of which is considerable, identify consumer’s future behaviour by ranking every SKU by the greatest likelihood of that individual consumer to purchase from all the SKUs listed, in order of greatest propensity. It presents them to that individual at exactly the right moment, thereby maximising that individual’s customer lifetime value CLV potential. (i.e. Likelihood to Purchase, Discount Affinity, Likelihood to Churn etc).
Data Analytics: the current operational framework
Data Analytics can now be considered through SwiftERM’s autonomous individualisation. Product relevance is recalculated for each identifiable customer from that customer’s own behavioural and transactional evidence, rather than being assigned by a fixed segment, campaign or predetermined journey. This distinction matters because an individual’s interests can change between visits, purchases and periods of inactivity. A current decision therefore needs current evidence.
SwiftERM evaluates the products that are becoming most relevant to each person and applies that decision autonomously. The operating model does not depend on a marketer continually creating segments, selecting products or scheduling another campaign. It is designed to use first-party behavioural and transactional signals already associated with an identifiable customer, so the decision remains specific to that customer rather than a broad cohort.
For Data Analytics, the practical test is not whether a retailer can create more rules. It is whether the system can recognise a change in an individual’s buying intention, reassess the available products and act without waiting for a manual campaign cycle. The output must remain traceable to the customer evidence and the ecommerce catalogue used to make the decision.
Implementation also needs disciplined data handling. Product identifiers, availability and customer events must remain consistent enough for relevance to be recalculated. Existing ecommerce operations should retain control of catalogue truth, order truth and customer permissions. Autonomous individualisation then operates within those established boundaries instead of inventing a parallel customer record or an ungoverned product feed.
The commercial value of Data Analytics should be assessed through observed customer response, orders and turnover, not through the volume of campaigns produced. That keeps attention on whether product selection becomes more useful to the individual and whether the retailer captures demand that would otherwise remain unrecognised. It also separates autonomous decision-making from conventional automation that simply executes a previously written rule faster.
This current framework preserves the original article’s subject while bringing its explanation into line with SwiftERM’s present capability: one identifiable customer, individually recalculated product relevance, and an autonomous decision made from that person’s own changing evidence. The same principle applies as catalogue choice, customer behaviour and commercial conditions continue to change over time.
In operational terms, the retailer retains the commercial context while the software performs the individual calculation. That division is important: the catalogue and customer record remain governed business assets, while product selection responds continuously to evidence rather than to a static assumption made when a campaign was first configured.